Advanvance Search by Filter
Refine your queries with precision using a variety of customizable filters
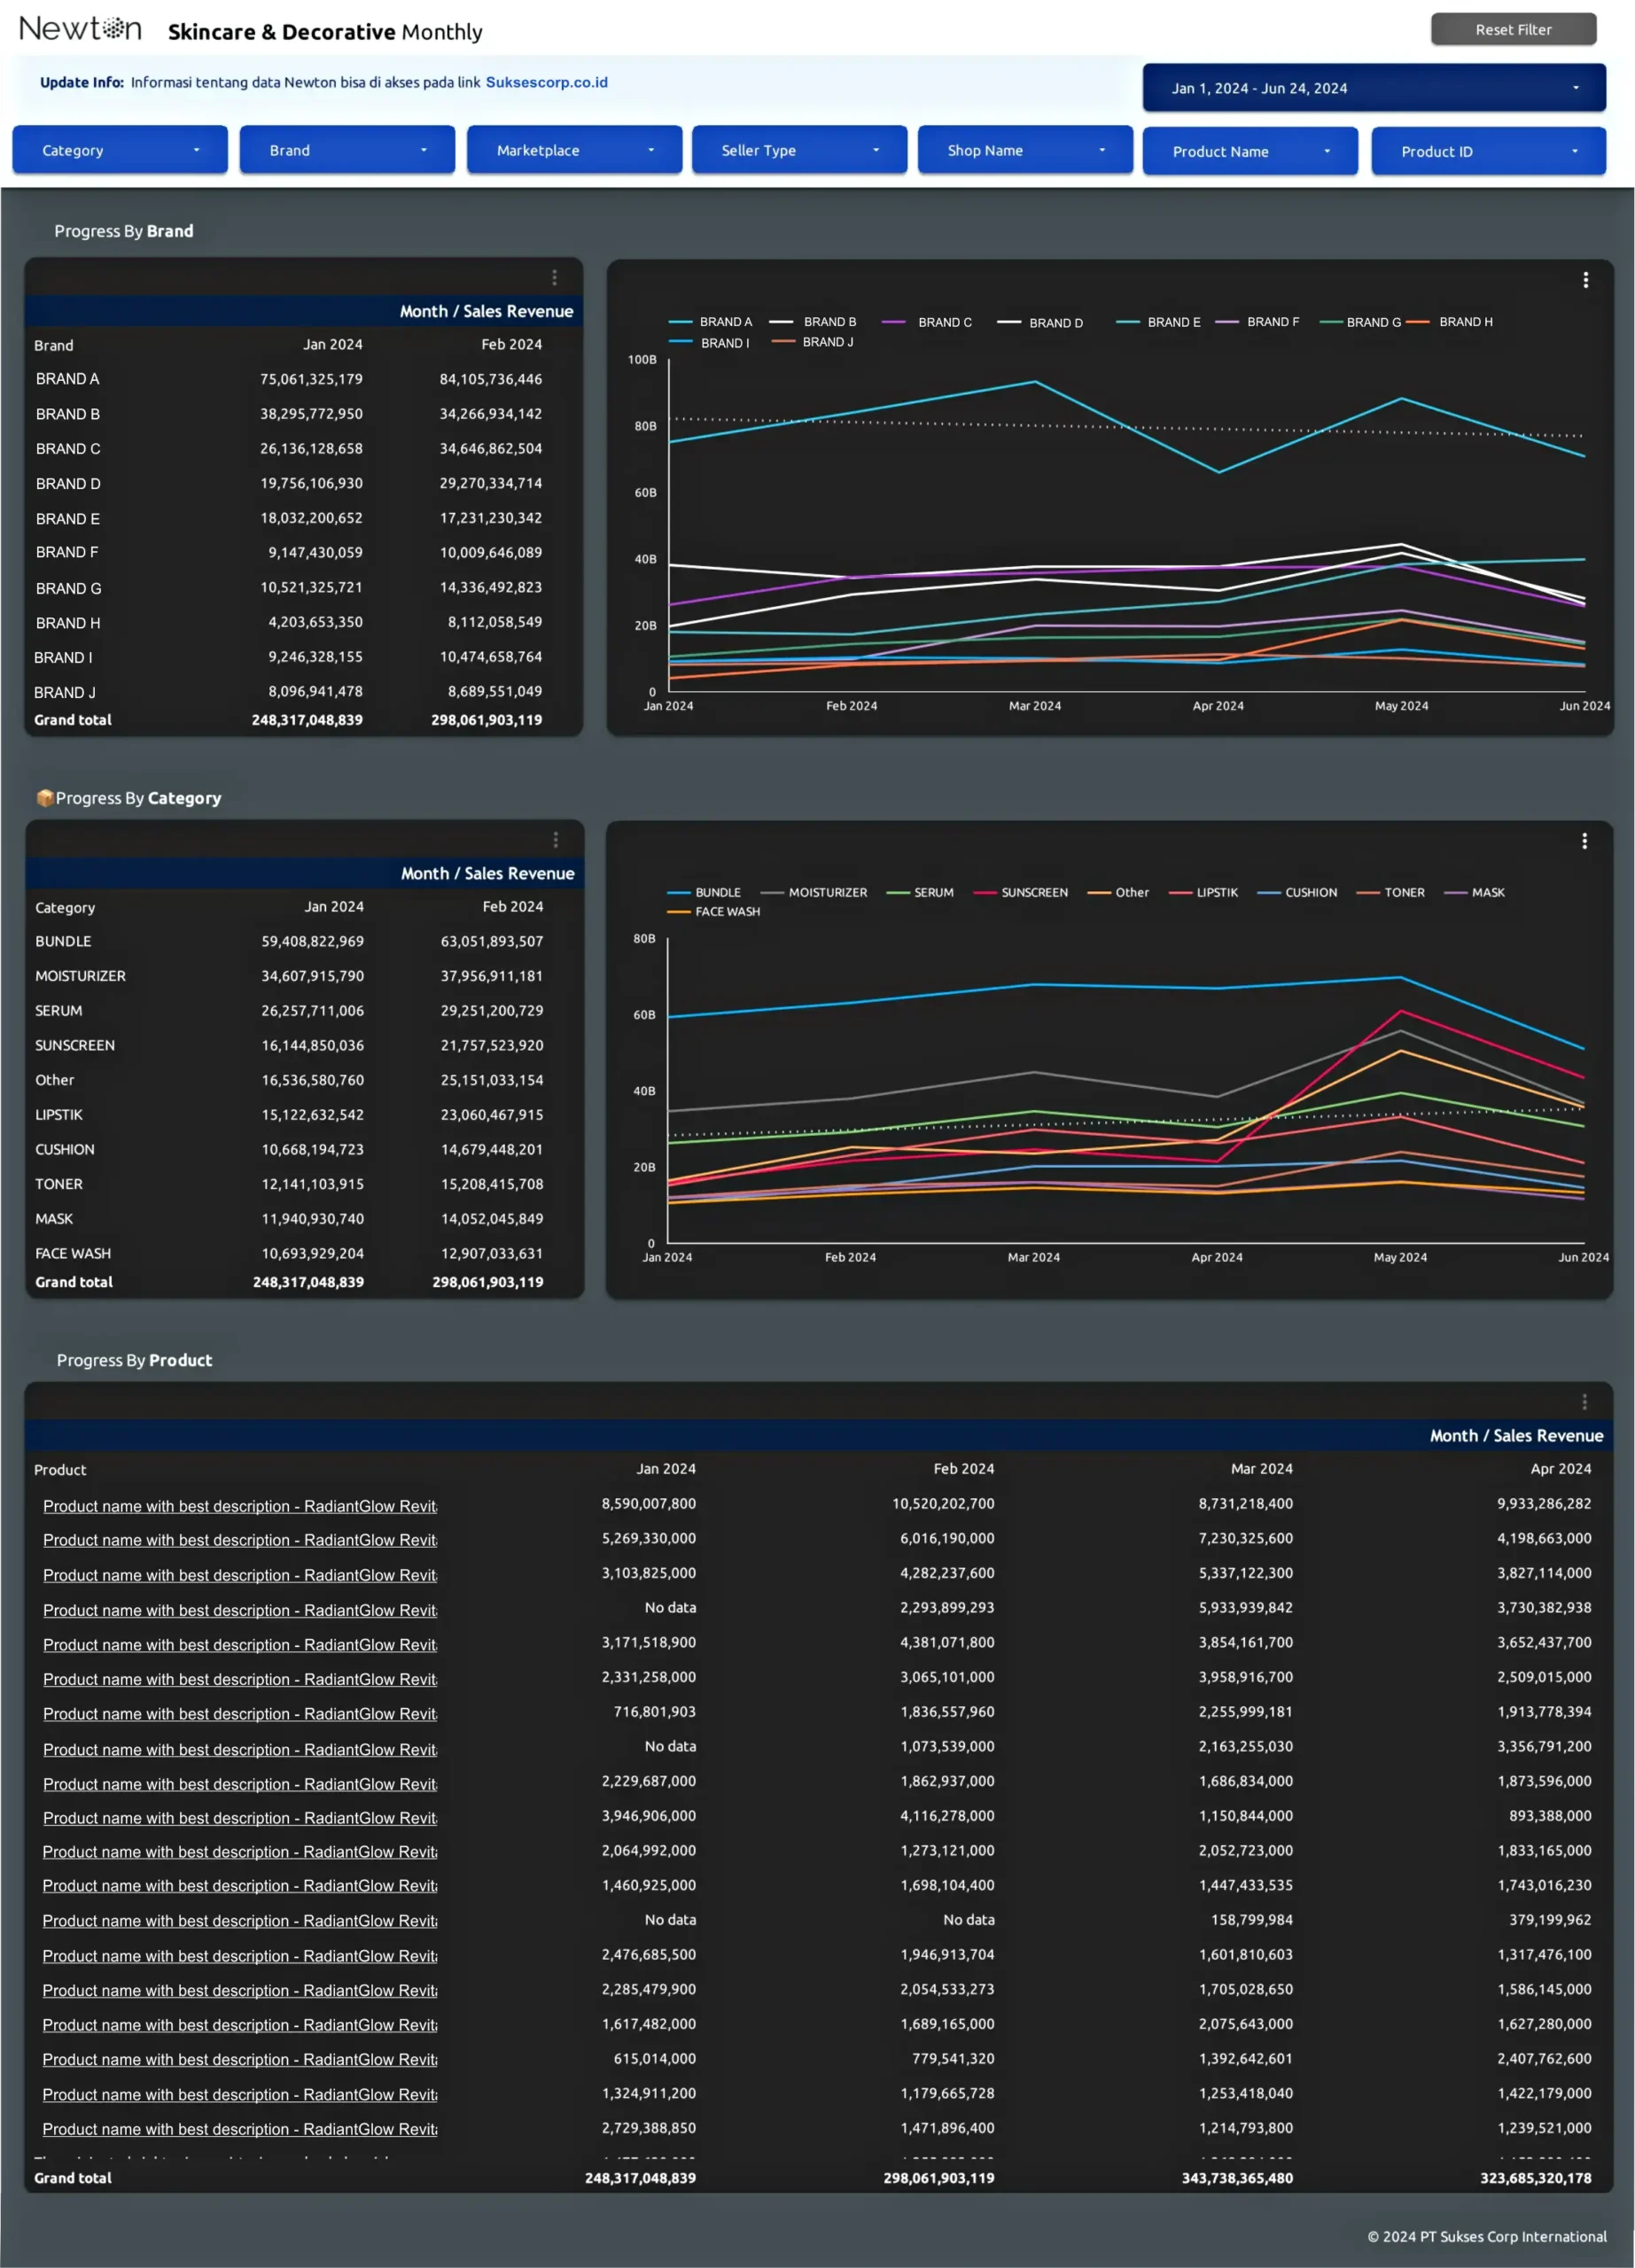
Progress by Brand
This is a list progress of the top 10 brands in your product market include your brand.
Graphic Progress of All Brand
Provides a graphical representation of key sales metrics for a month for all brands
Progress by Category
This is a list progress of the top 10 category in your product market.
Graphic Progress of All Product Categories
Displays total sales trend metrics in product categories in each month
Progess by Product
Showing the best performing products in various categories from all brands